Contest Marketing Strategy: Data from 70,000+ Campaigns [2026]
Every week, contest hosts ask me the same questions. How long should my giveaway run? Which entry methods actually get completed? Does launching on a Monday really matter, or is that just marketing folklore? After hearing these questions thousands of times over 8 years, I realized I was sitting on the data to answer all of them. So I pulled the numbers from 70,000+ campaigns on our platform, and some of what I found genuinely caught me off guard.
I’m one of the co-founders at SweepWidget. We’ve powered contests and giveaways for over 50,000 businesses across 100+ countries, so I’ve seen every type of campaign you can imagine. Whether you’re building your first contest marketing strategy or refining an existing one, every section below has charts, specific numbers, and a recommendation you can act on today.
Table of Contents
- Key Findings: How to Optimize Your Contest
- Which Platforms Drive the Most Contest Entries?
- Which Entry Methods Actually Get Completed?
- How Many Entry Methods Should You Use?
- How Long Should Your Contest Run?
- When Do Most Entries Come In? (The U-Curve)
- Best Day and Time to Launch a Contest
- Where Do Contest Entries Come From?
- Do Leaderboards Actually Work?
- How Are Hosts Protecting Their Contests?
- What 70,000+ Campaigns Taught Me
- Frequently Asked Questions
Key Findings: How to Optimize Your Contest
Before we get into the full breakdown, here are the highlights. These are the most actionable takeaways from analyzing 70,000+ contests and giveaways over 8 years. If you’re putting together a giveaway marketing strategy, start here.
- 8-14 day duration = 956 avg entrants (7x more than flash giveaways)
- 8-12 entry methods = 1,926 avg entrants (12x more than single-method contests)
- Launch on Monday = highest-entry day. Peak hour: 8pm UTC.
- Instagram dominates with 570K entries in 2025. TikTok is the fastest-growing.
- Leaderboard mode = 3.3x more actions per user than standard random-draw.
- Entries follow a U-curve. First 10% and last 10% of your contest generate the most activity.
- 97% of hosts block VPNs. 90% check for duplicate IPs. Don’t skip security.
Now let me show you where each of these comes from. Every section below has the charts and the numbers behind it, so you can see exactly why these work and build a contest marketing strategy around real data.
Which Platforms Drive the Most Contest Entries?
This one has shifted dramatically over the years, and I find the timeline fascinating. When I looked at our 2025 data (the most recent full year), the platform ranking was clear.
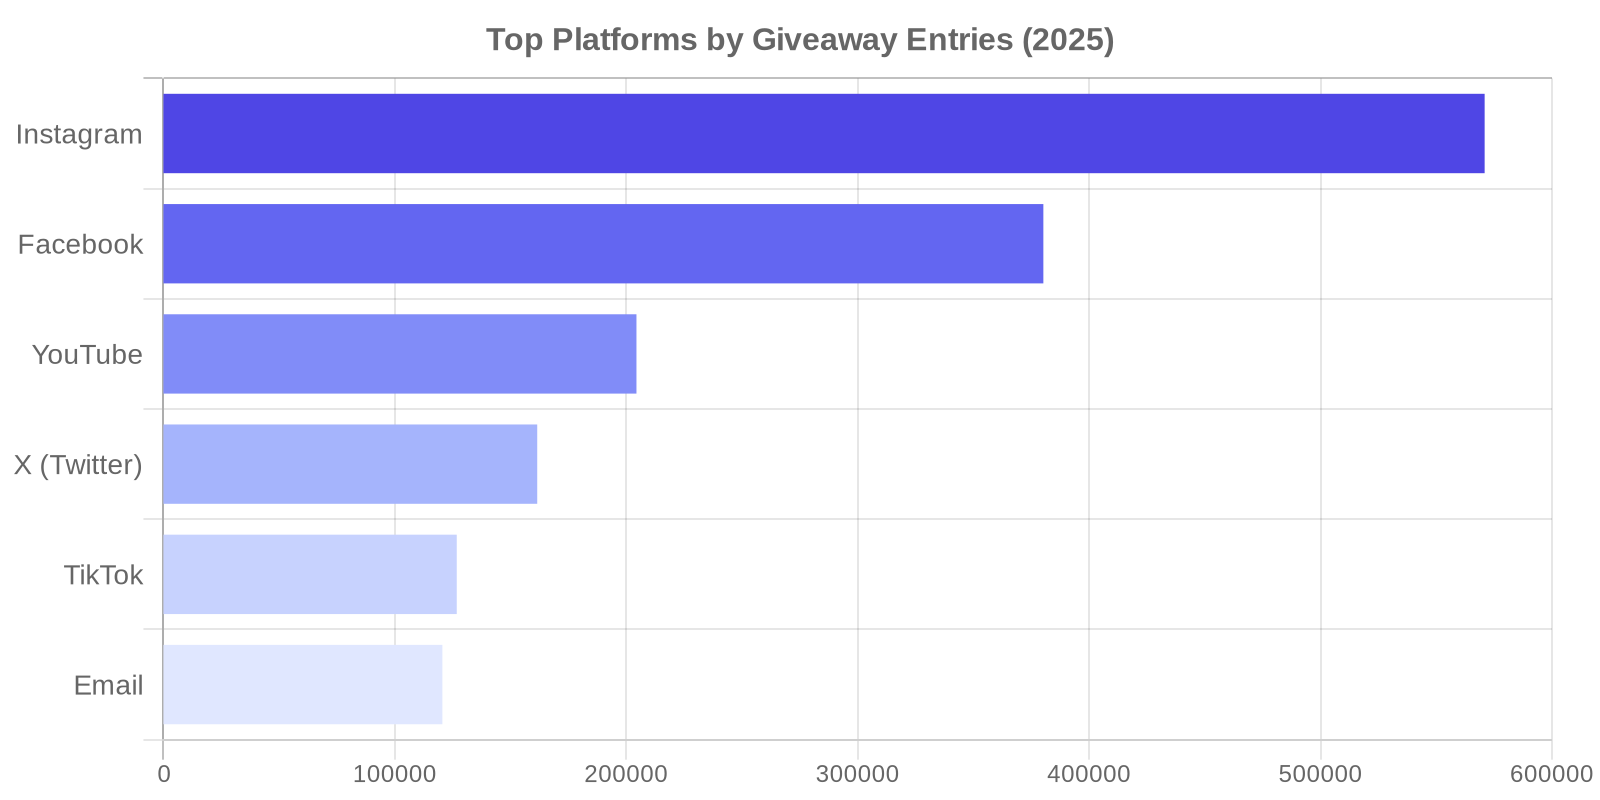
Instagram led with 570,895 total entries across all entry methods tied to the platform. Facebook came in second at 380,215. YouTube pulled 204,392, X (formerly Twitter) had 161,513, TikTok contributed 126,745, and email subscriptions rounded things out at 120,528.
The year-over-year trends are interesting too. In the early years, Twitter dominated contest marketing. Then Instagram started climbing around 2019 and took the top spot by 2020. It’s held the lead since, and the gap keeps widening. What I like about this space is that the platform mix keeps evolving. There’s always a new opportunity opening up.
The story I’m most excited about going into 2026 is TikTok. It was over 126,000 in 2025. I also think email subscriptions are underrated. They don’t have the flash of a social platform, but 120,000+ completed email entries tells me smart contest hosts are building owned audiences, not just social followers. Many people also connect their “subscribe to newsletter” entry methods with a CRM (Klaviyo is by far the most popular followed by Mailchimp).
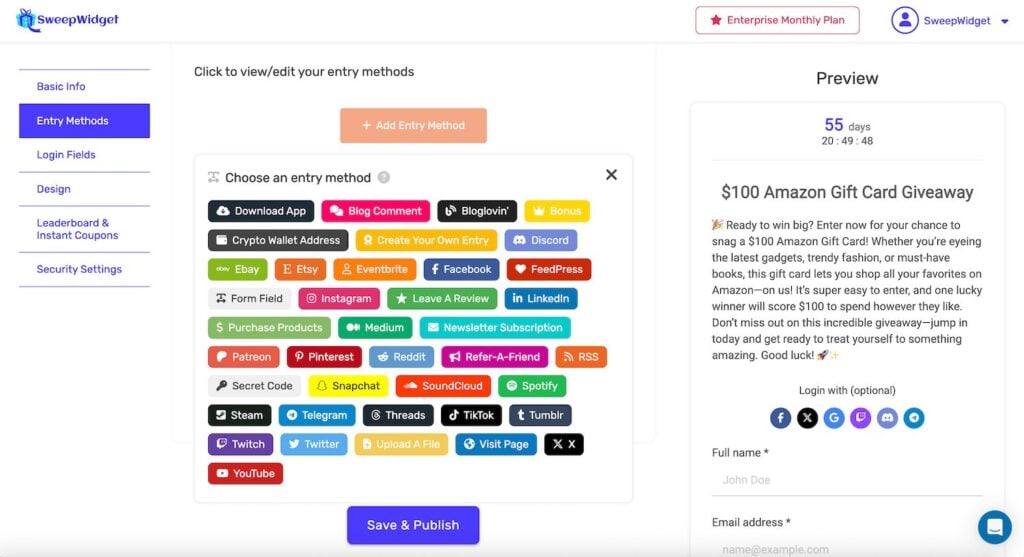
Which Entry Methods Actually Get Completed?
This might be the most useful section in the entire article. There’s a big difference between the entry methods hosts add to their contests and the ones entrants actually complete. Once I saw this pattern, it changed how I think about contest design.
The most popular methods that hosts configure are user details (the login/signup step, added to 38,000+ contests), Instagram follow (24,000+), Twitter follow (23,000+), and visit a page (20,000+). Those are the methods contest creators reach for most often. Makes sense.
But here’s what the completion data actually looks like.
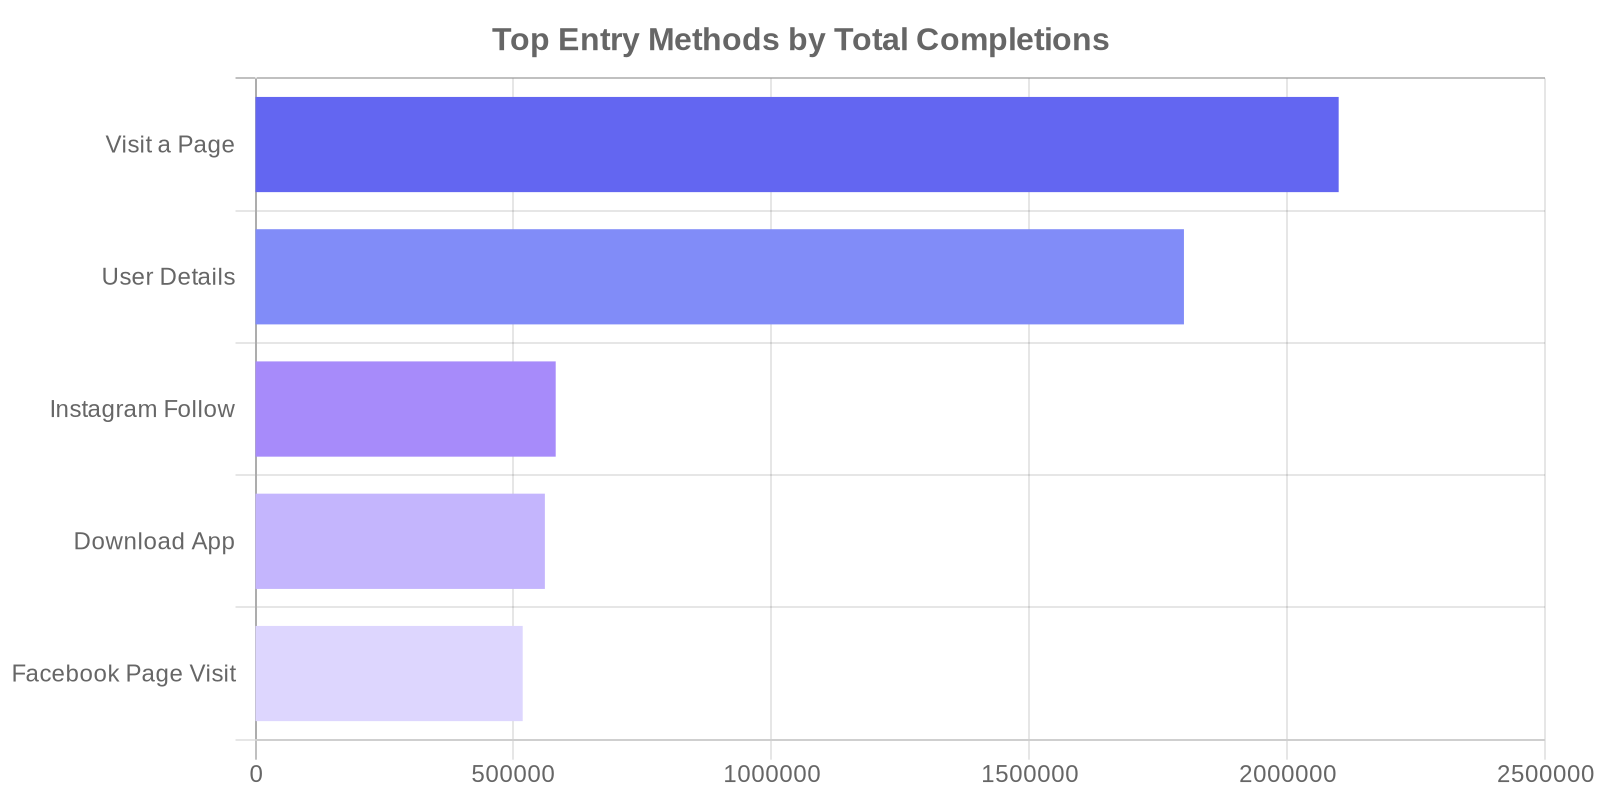
Visit-a-page variants led with over 2.1 million completions. User details came in at 1.8 million. Then there’s a significant drop: Instagram follow at 582,000, download app at 561,000, and Facebook page visit at 518,000. The entry methods that don’t require verification or extra effort get completed at much higher rates. That’s the insight I keep coming back to.
Does that mean you shouldn’t use Instagram follow or other social entry methods? Not at all. They’re great for growing your audience. But pair them with easy-to-complete methods like visit-a-page or answer-a-question. That way, entrants who aren’t ready to follow your account still complete something, and you still capture the engagement. I started structuring my contests this way and saw noticeably higher completion rates across the board.
How Many Entry Methods Should You Use?
I used to think adding too many entry methods would overwhelm people. Turns out, the data says the opposite.
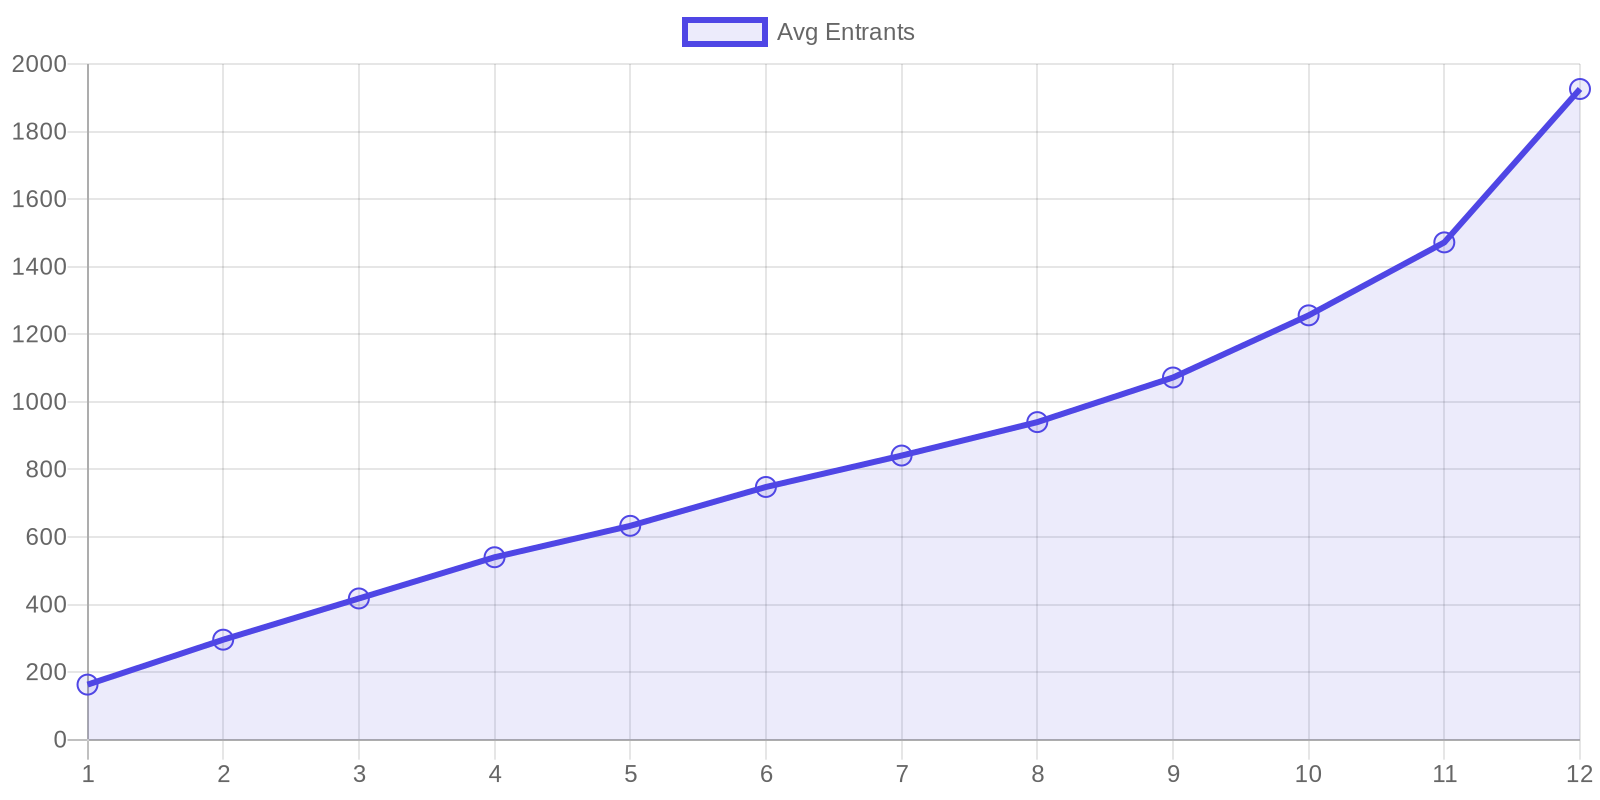
Contests and giveaways with just 1 entry method averaged 163 entrants. Bump that to 5 methods and the average jumps to 787. At 10 methods, you’re looking at 1,256 average entrants. And contests with 12 entry methods averaged 1,926 entrants. That’s nearly 12x more entrants just by giving people more ways to participate. Pretty encouraging, right?
The curve is remarkably consistent. I expected to see a plateau or even a decline at some point (decision fatigue, right?), but the data doesn’t show one in the 1-12 range. Each additional method gives people another reason to engage, another way to earn entries, and another touchpoint with your brand.
My recommendation: use 8 to 12 entry methods. Mix platforms (Instagram, TikTok, YouTube), add some simple options (visit a page, answer a question), and include at least one high-value action (like a refer-a-friend or email subscribe). The data backs this up clearly. More methods means more entrants. SweepWidget supports over 100 entry method types across every major platform, so you have plenty to choose from.
How Long Should Your Contest Run?
Duration is one of those things every contest host thinks about. Too short and nobody finds it. Too long and people forget about it. I pulled the data to find out where the sweet spot actually is.
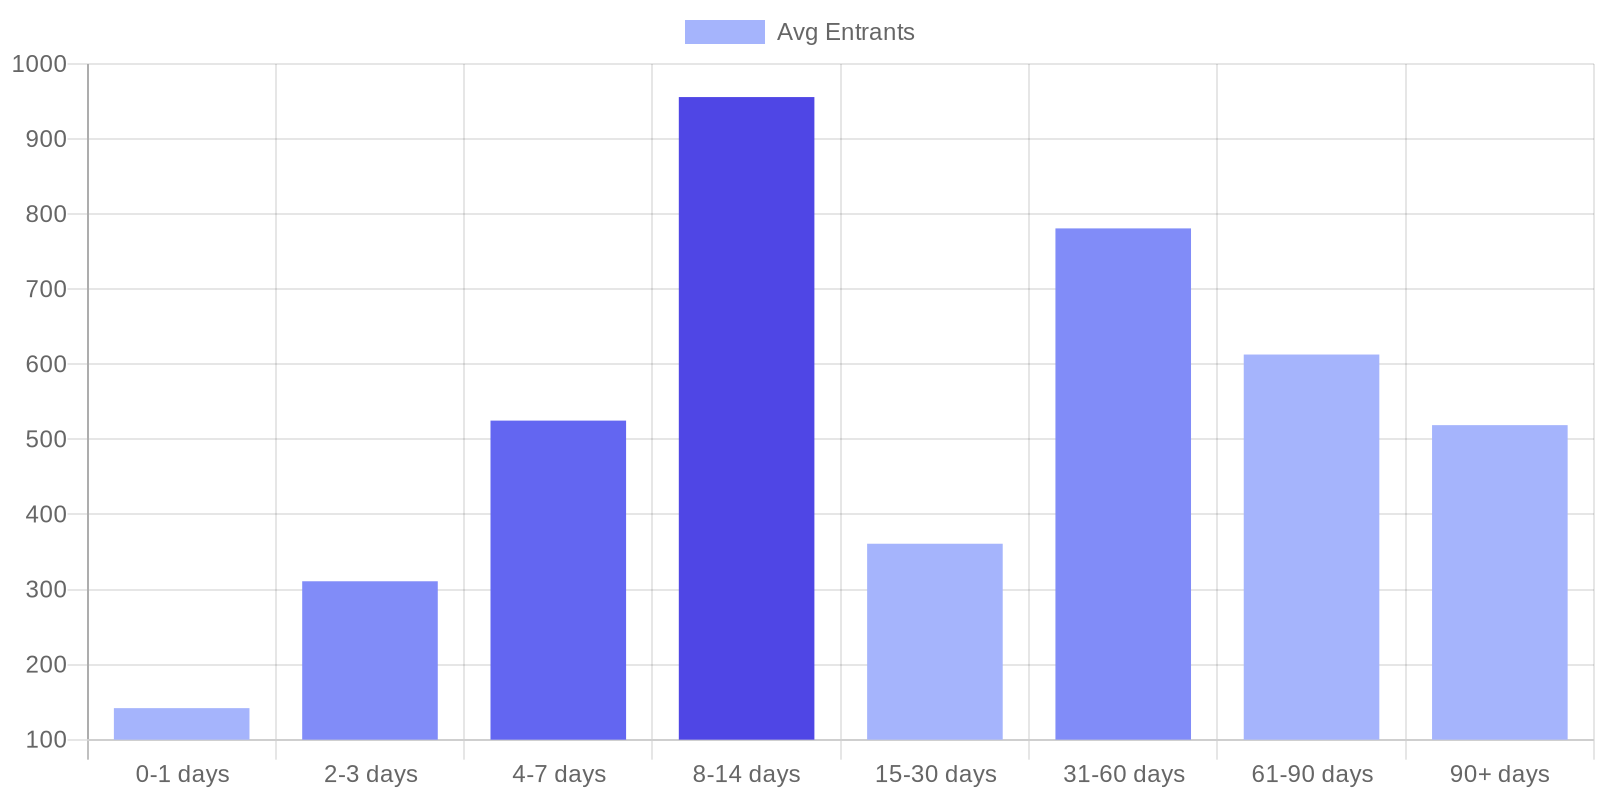
Contests running 0 to 1 day averaged just 142 entrants. Jump to 4-7 days and you get 525. But the real winner? 8 to 14 days averaged 956 entrants, the highest of any duration bracket with a meaningful sample size. That’s almost 7x more entrants than a flash contest.
After 14 days, things shift. The 15-30 day bracket drops to 361 average entrants. I was genuinely surprised by that. I assumed longer would always mean more total entries, but urgency matters more than time. When people see “ends in 3 days,” they act. When they see “ends in 25 days,” they bookmark it and forget. Shorter timelines work in your favor.
One note: the 31-60 day bracket shows 781 average entrants, but that bucket only has 301 giveaways compared to the thousands in shorter brackets. It’s likely skewed by a few big-audience campaigns. I wouldn’t use it as a benchmark.
Run your contest for 1 to 2 weeks. That’s the sweet spot. Long enough to build momentum and get shared. Short enough to keep the urgency alive. If I’m planning a contest tomorrow, I’m setting it for 10 days and not second-guessing it.
When Do Most Entries Come In? (The U-Curve)
This one produced my favorite chart in the entire study. I divided every contest’s lifespan into 10 equal segments (first 10%, next 10%, and so on) and counted total entries in each bucket. The result is a textbook U-shaped curve.
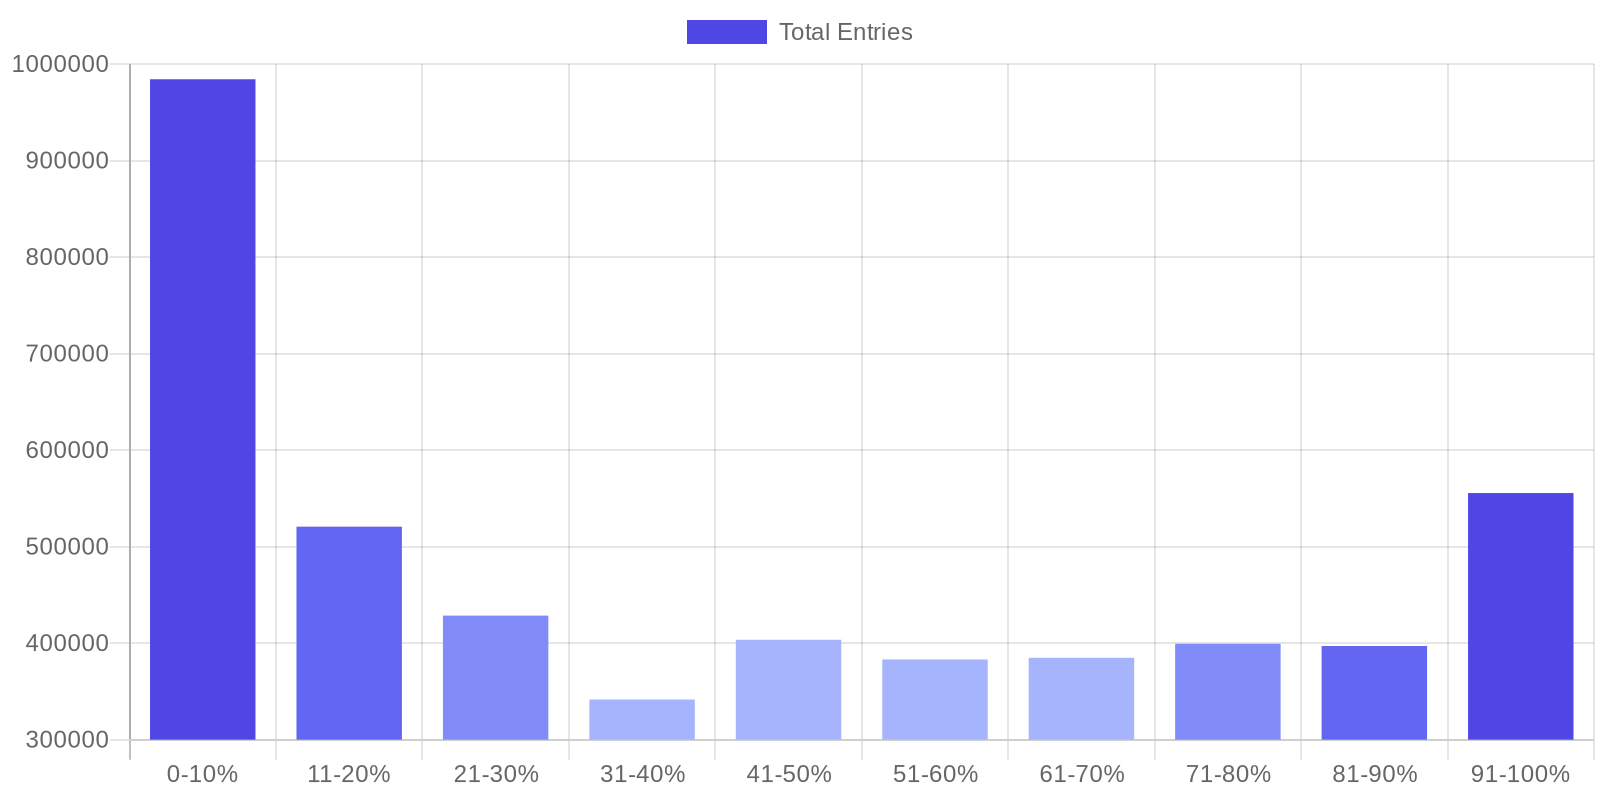
The first 10% of a contest’s lifecycle accounts for 984,000 entries. That’s the launch-day excitement, people sharing it fresh, the initial promotional push hitting all at once. Then activity dips in the middle, which is completely normal. By the 31-40% mark, entries settle at around 342,000. This is just how engagement works, and once you know the pattern, you can plan for it.
Then comes the deadline surge. Entries climb back up, and the final 10% of the contest lifecycle pulls in 556,000 entries. People respond to urgency. They see “ends tomorrow” in their notifications or email and take action. This is exactly why countdown reminders work so well.
Once I understood this pattern, I completely changed how I plan promotion. Now I go heavy at launch (social posts, email blast, partner shoutouts, everything at once). During the middle, I keep a lighter touch with reminders. Then I ramp back up for the final 2-3 days with countdown messaging. The U-curve is a pattern you can use to your advantage. Plan your biggest promotional pushes for launch day and the final 2-3 days, and you’ll capture both entry surges naturally.
Best Day and Time to Launch a Contest
Alright, let’s get specific about timing. I looked at entries by day of the week and hour of the day, and the patterns are surprisingly consistent.
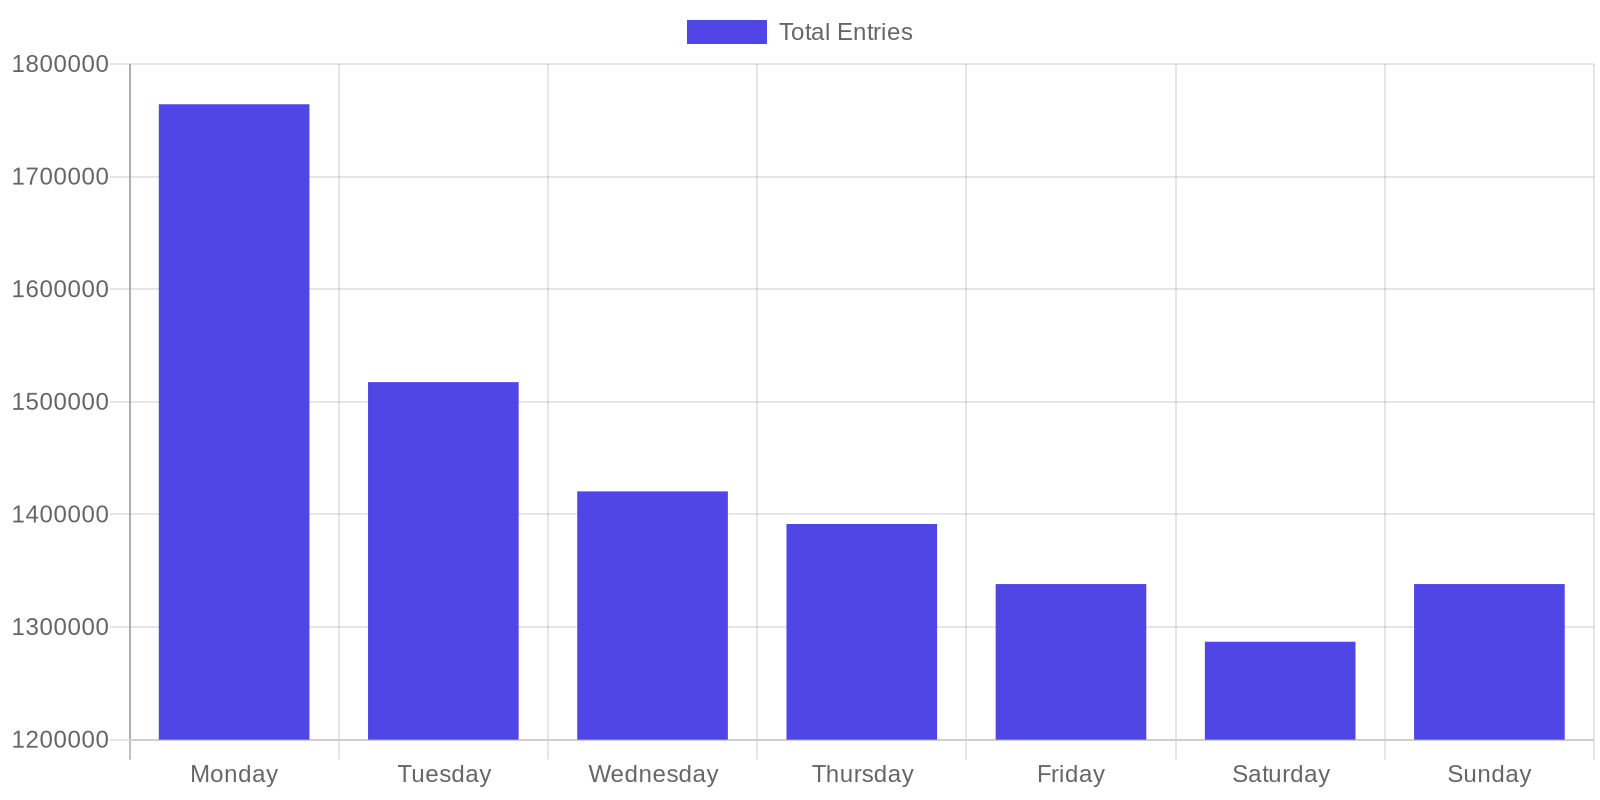
Monday is the clear winner with 1.76 million total entries. Tuesday comes in at 1.2 million, and there’s a steady decline through the week. Saturday dips to 1.2 million, but Sunday bounces back to 1.45 million, which I thought was interesting. People seem to have time on Sunday evenings for browsing and entering contests and giveaways.
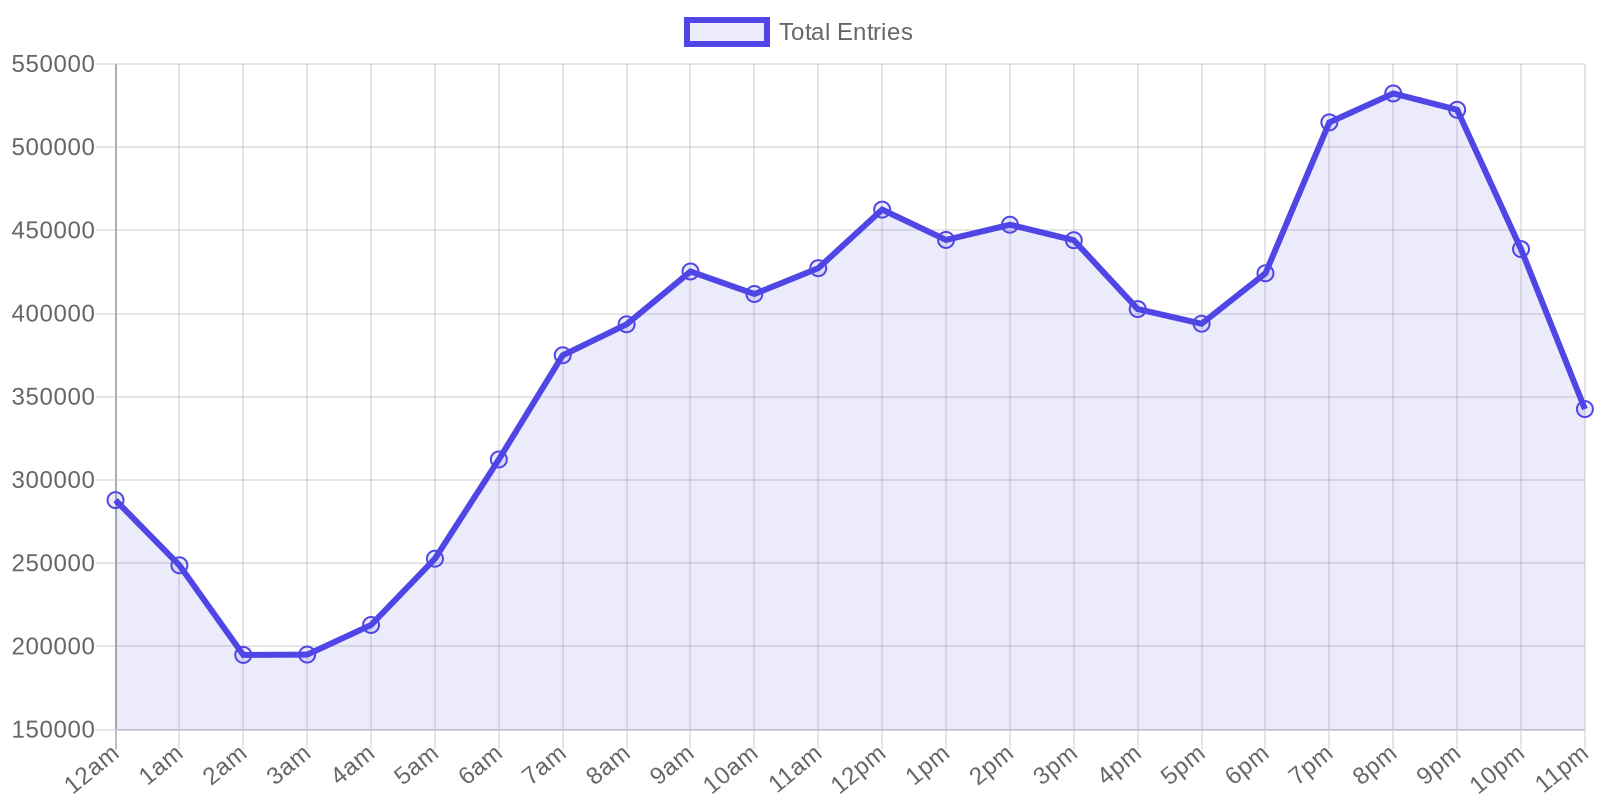
For time of day, the peak is 8pm UTC with 532,000 entries. There’s a secondary bump around noon. The lowest activity is between 2am and 3am UTC, which makes sense. People enter giveaways during lunch breaks and after work/dinner. Not exactly shocking, but it’s nice to have the data confirm it.
I also looked at when hosts actually launch their contests. Monday is the most popular launch day too, with 11,672 giveaways started on Mondays. Weekdays dominate overall. So hosts already seem to intuitively pick the right day, and the entry data backs them up.
My advice: launch on a Monday morning so you capture that first-day surge during the evening peak hours. If you’re targeting a specific timezone (say, the US), time your announcement to land around lunchtime Eastern. That way you hit the noon bump and the evening bump on the same day.
Where Do Contest Entries Come From?
I pulled our analytics data to see where contest entries actually come from, and the global reach surprised me.
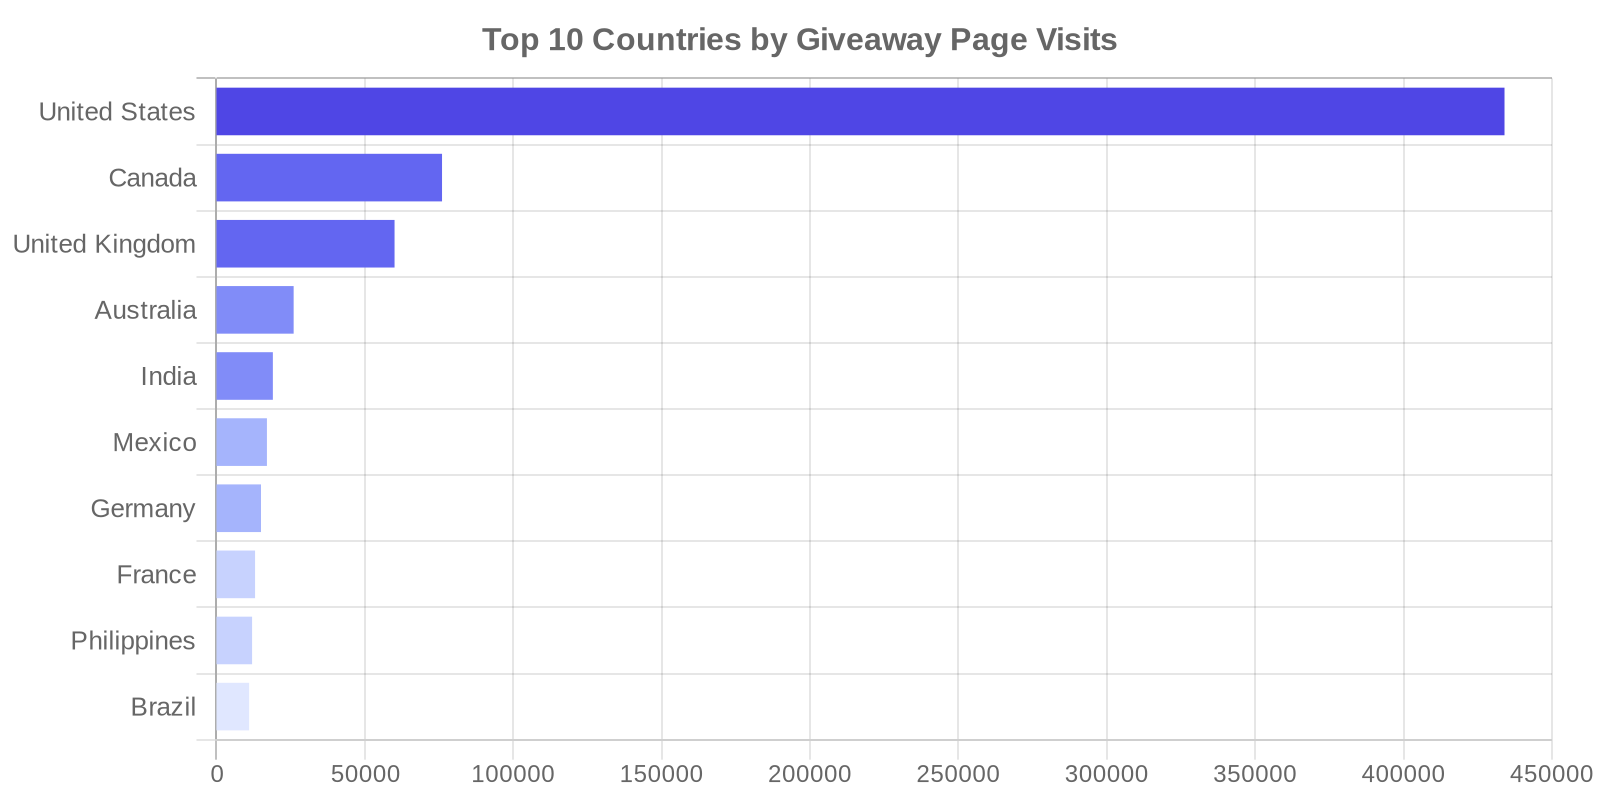
The United States leads with 434,000 visits across 1,153 unique contests. Canada is second at 76,000, then the UK at 60,000, Australia at 26,000, India at 19,000, and Mexico at 17,000. In total, we see contest participation from over 100 countries. Even if you’re targeting a single market, your contest is reaching a global audience. That’s something worth keeping in mind when you’re setting up geographic targeting and language options.
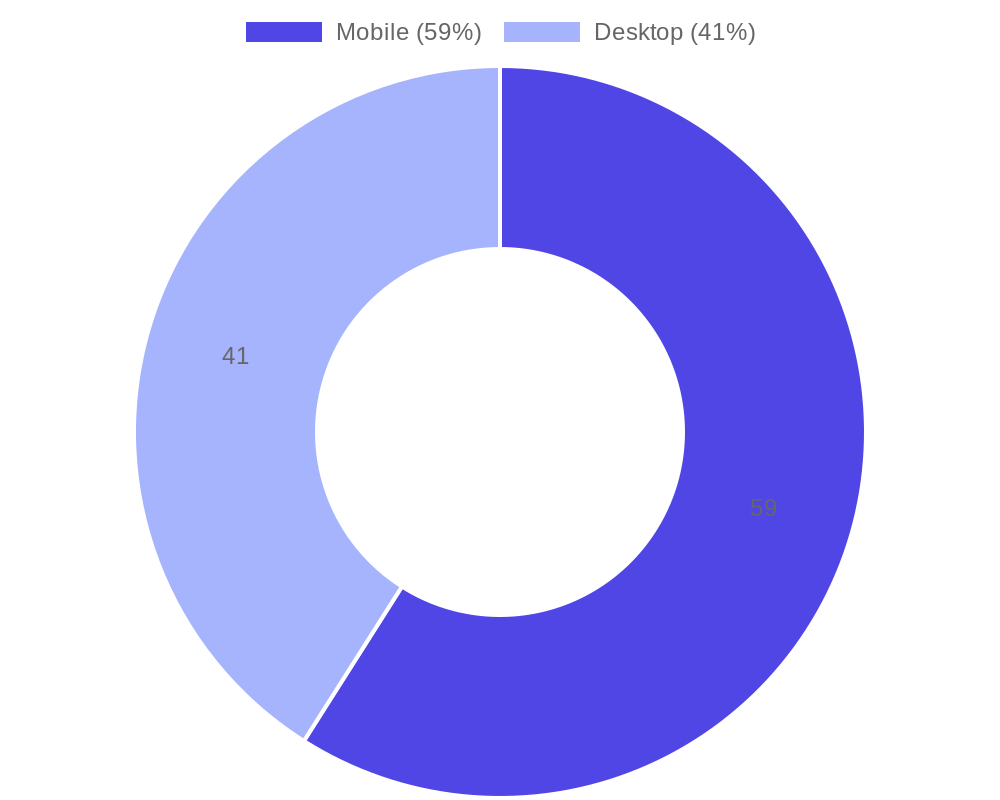
On the device side, 59% of contest page visits in 2025 came from mobile and 41% from desktop. I expected maybe 55/45, so the gap was wider than I’d guessed. SweepWidget is fully optimized for mobile, and we also see 31 languages represented across the platform (even though we support 103 languages). If you’re running contests for international audiences, multi-language support is worth considering.
Do Leaderboards Actually Work?
Leaderboard-style contests outperform standard ones, and the gap is bigger than I expected.
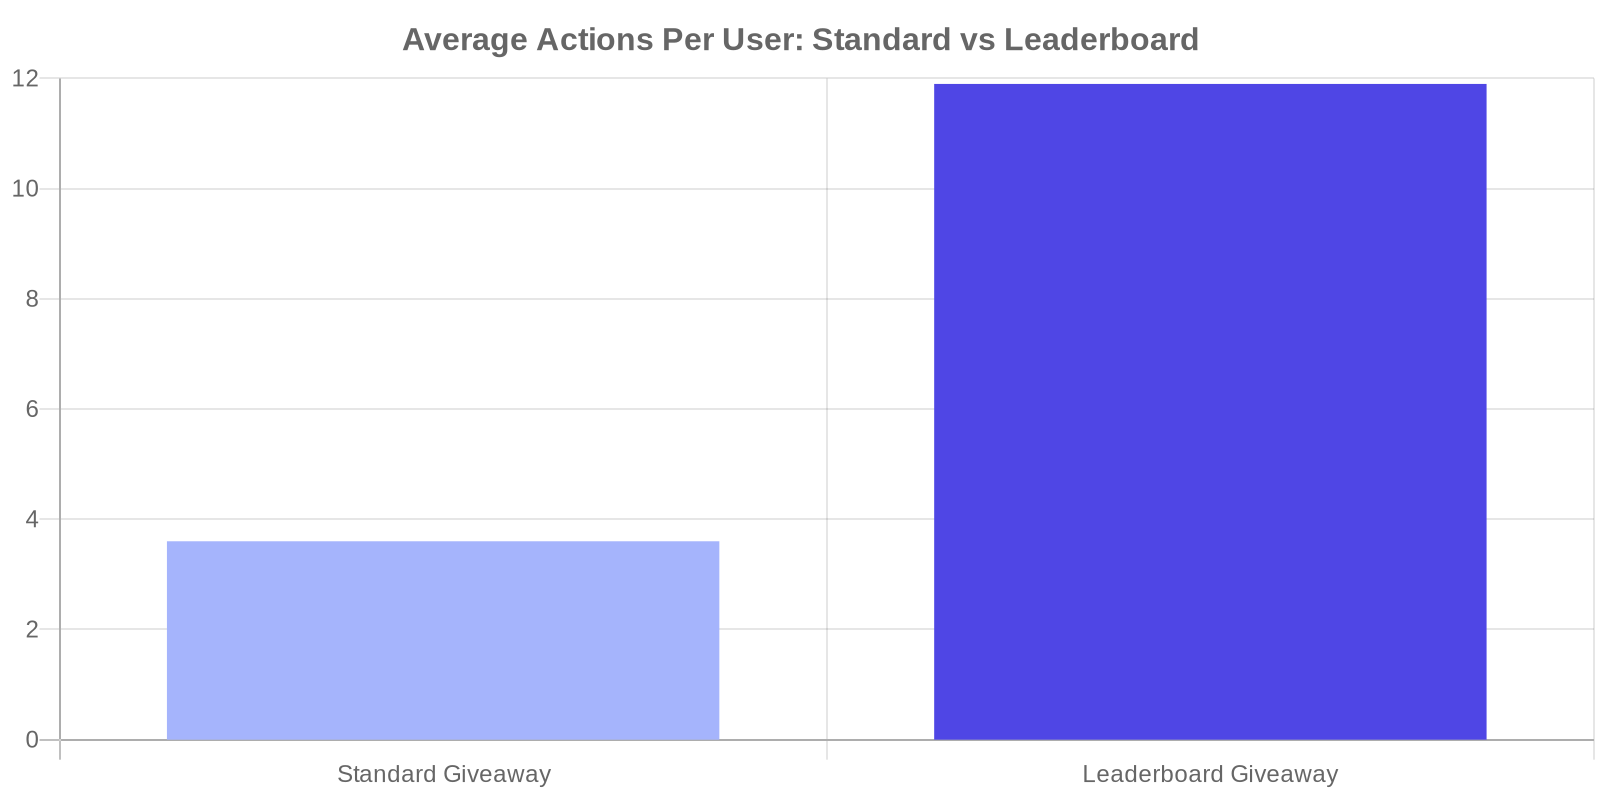
In a standard random-draw contest, users complete an average of 3.6 actions. In leaderboard mode, that jumps to 11.9 actions per user. That’s a 3.3x difference in actual engagement, which is a bigger gap than I would have guessed.
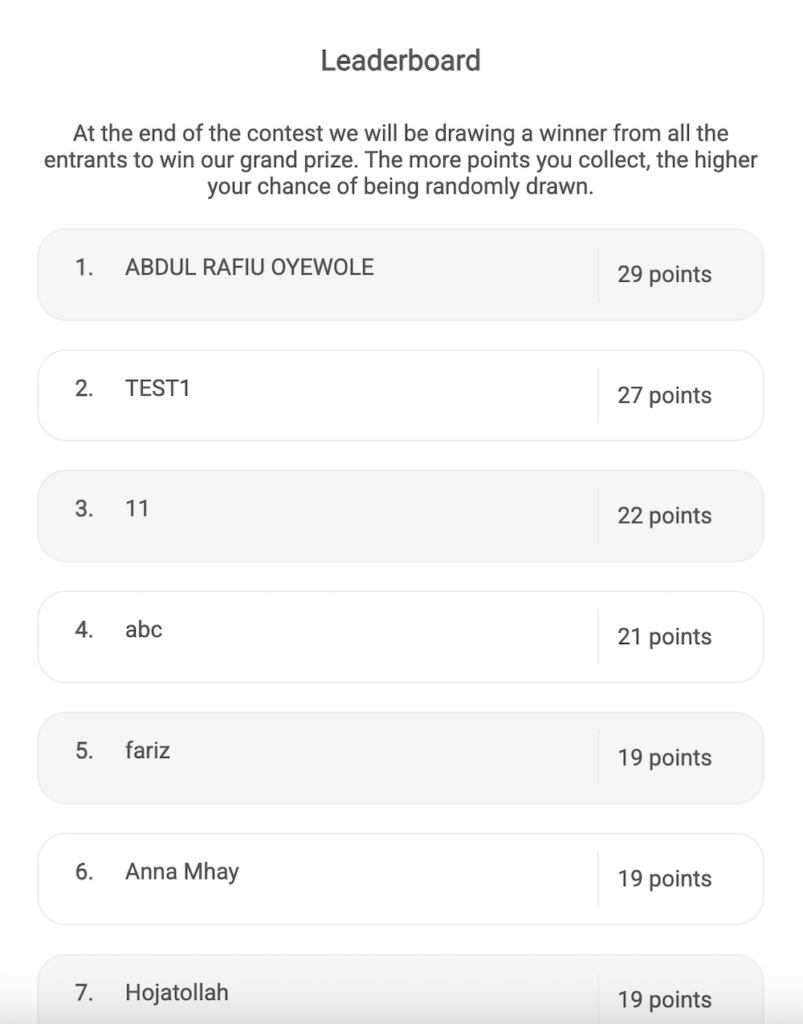
The reason makes sense once you think about it. In a standard contest, you enter once (or a few times) and hope for the best. In leaderboard mode, the person with the most entries wins. That transforms the promotion from a passive lottery into an active competition. People come back every day. They share their referral links. They complete every available entry method, multiple times if daily entries are enabled.
I also checked the engagement depth data. In leaderboard contests, 28% of users complete 6 or more actions, compared to 16% in standard mode. Users are more invested, more competitive, and more likely to keep coming back.
That said, leaderboard mode isn’t for every situation. If your goal is maximum reach (getting your brand in front of as many unique people as possible), a standard random-draw contest is still solid. But if you want deep engagement, repeat visits, and viral sharing, leaderboard mode is a clear step up. It turns a contest into a game, and people love games.
How Are Hosts Protecting Their Contests?
Security is one of the things I’m most proud of at SweepWidget, and the data shows our hosts take it seriously too.
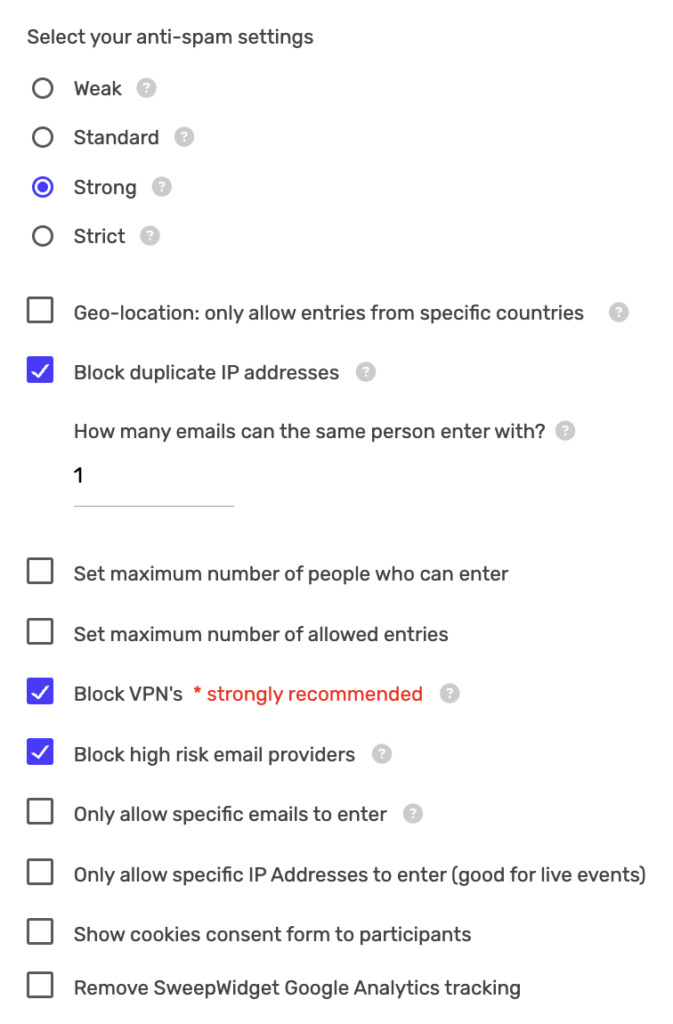
97% of contest hosts on SweepWidget block VPNs. 90% check for duplicate IP addresses. Security Level 1 (our recommended baseline setting) is the most popular choice, used by 34,579 contests. These protections are built right into SweepWidget, so you’re covered from the start.
One trend I found genuinely encouraging: our fraud detection keeps getting sharper. Disqualification rates have risen from near 0% in the early years to about 0.6% in 2026, which means the tools are catching more bad actors than ever. Your legitimate entrants get a fair shot, and you can pick winners with confidence.
My recommendation: enable VPN blocking and duplicate IP checks as a baseline. If your prize value is high (over $500), consider using Security Level 2 or higher for extra protection. SweepWidget’s fraud dashboard also lets you review flagged entries before picking a winner, so you’re always in control of who wins.
What 70,000+ Campaigns Taught Me
Looking back at all of this, the thing that stands out most to me is how much of contest marketing comes down to a few core decisions. Run it for 8-14 days. Offer 8-12 entry methods. Launch on a Monday. Promote hard at the start and finish. None of that is complicated, but before I had the data in front of me, I was guessing at most of it. Now I don’t have to, and neither do you.
Writing this article was the first time I sat down and really looked at what 70,000+ campaigns have to teach us. Some of it confirmed what I expected. Some of it changed how I think about contest strategy entirely. If even one section above makes you rethink how you set up your next campaign, it was worth putting together. Create a free contest on SweepWidget and put the data to work.
Frequently Asked Questions
What is sweepstakes in marketing?
A sweepstakes is a promotional campaign where winners are chosen by random draw rather than skill or merit. In marketing, businesses use sweepstakes to generate leads, grow social media followers, and increase brand awareness. Based on our data from 70,000+ giveaways, sweepstakes consistently drive hundreds to thousands of entries when set up with the right combination of entry methods and duration.
What’s the difference between a giveaway and a contest?
A giveaway (or sweepstakes) picks winners at random. A contest picks winners based on skill, like the best photo submission or highest score on a leaderboard. Both are effective for marketing. Our data shows that leaderboard-style contests generate 3.3x more completed actions per user than random-draw giveaways, while standard giveaways tend to attract a wider pool of unique entrants.
Do giveaways work for marketing?
Yes. Our analysis of 70,000+ giveaways shows that volume has remained steady at 700-1,000 per month for three years running. Businesses don’t keep using a channel that doesn’t deliver. Giveaways with 8-12 entry methods average nearly 2,000 entrants, giving brands significant reach and engagement from a single campaign.
Are giveaways worth it?
Based on our data, absolutely. Even giveaways with a single entry method average 163 entrants. With 8-12 methods, that number climbs above 1,200. The key is combining the right entry methods, running for 8-14 days, and promoting around the natural entry velocity U-curve to maximize participation.
How do giveaways work?
A business creates a giveaway with a prize and a set of entry methods (follow on Instagram, visit a page, subscribe to an email list, etc.). Users complete those actions to earn entries. At the end of the giveaway period, a winner is drawn randomly or ranked by a leaderboard. Based on our data, the most effective contests run for 8-14 days and offer 8-12 different ways to enter.
What is the best day to run a giveaway?
Monday. Our data shows Monday generates the most entries of any day of the week, with 1.76 million total entries compared to a weekly average of about 1.3 million. The best time to promote is around 8pm UTC, which is the single highest-entry hour. Launch early on Monday and promote during the evening for maximum first-day impact.
How many entry methods should a giveaway have?
Our data from 70,000+ giveaways shows a clear correlation: more entry methods means more entrants. Giveaways with 1 method average 163 entrants. With 10 methods, that jumps to 1,256. The sweet spot is 8-12 entry methods, mixing social platforms with simpler actions like visiting a page or answering a question.
How do contests and giveaways help with promotion?
Contests and giveaways help with promotion by driving social engagement, growing email lists, and increasing brand visibility in a short window. Our data shows that a single well-structured contest with 8-12 entry methods can attract nearly 2,000 entrants. Each entry method creates a touchpoint, whether that’s a social follow, a page visit, or an email signup. The U-curve pattern also means entries surge at the start and end, giving you two natural peaks of promotional activity from one campaign.
How long should a giveaway last?
8 to 14 days. That duration bracket averaged 956 entrants in our data, the highest of any bracket with a large sample size. Giveaways shorter than 4 days don’t have time to build momentum, and giveaways longer than 2 weeks see urgency fade. The entry velocity data confirms this: most entries come in the first 10% and final 10% of a giveaway’s lifespan, so a 10-14 day window gives you two strong entry surges without a long dead zone in between.